MarketPulse
May 10, 2025
📘 Project Background
The Company is a growing e-commerce brand specializing in sports and fitness equipment, catering to a wide audience of health-conscious consumers through digital marketing channels. With a diverse product catalog—from hockey sticks to yoga mats—the company’s strategy blends performance-driven gear with community-focused branding to attract both hobbyists and dedicated athletes.
As part of my role as a data analyst, I conducted a comprehensive marketing and performance audit of the company's digital product analytics. The goal was to evaluate product-level conversion trends, content effectiveness, and customer engagement, using data visualized in Power BI. This analysis is intended to provide clear, data-backed benchmarks that guide future sales strategies, product optimization, and campaign planning.
The project utilized data from January 2023 through May 2025 and focused on uncovering insights related to online user behavior, seasonal shopping patterns, and sentiment toward key products.
This report focuses on four key areas:
📊 Product Performance – Conversion rates and product-specific trends across the catalog.
🕒 Marketing Timing Patterns – Monthly engagement fluctuations in views, clicks, and likes.
💬 Customer Reviews & Sentiment – Analysis of review tone, volume, and average ratings.
🔗 SQL queries for data cleaning and analysis: [tbd]
🔗 Business question queries: [tbd]
📊 Interactive Power BI dashboard: [tbd]
🗂️ Data Structure & Initial Checks
This analysis is built on a well-structured relational database with a star schema, consisting of two dimension tables and three fact tables. The schema enables detailed exploration of product performance, customer behavior, social engagement, and review sentiment — all crucial for building marketing strategies grounded in data.
Initial data checks included:
Removing duplicates by JourneyID in the customer journey table.
Combining views and clicks into a single engagement metric.
Cleaning double spaces and formatting issues in review text.
Performing sentiment analysis on customer review data.
📊 Entity-Relationship Overview
Below is an overview of the tables included in this project:

🧭 Executive Summary
This performance analysis highlights key trends in product conversion, digital engagement, and customer sentiment across the company's e-commerce platform. While high-performing products continue to drive conversions, signs of declining engagement and suboptimal customer ratings suggest areas where strategic improvements can yield immediate returns.
🔍 Key Takeaways
Conversion recovery after mid-year slump: Conversion rates dropped to a low of 6.1% in October but rebounded to 11.4% by December, indicating successful end-of-year marketing or seasonal demand recovery.
Highly Seasonal Interactons: From January until December the Views are declining every year. With January being the stronges with about 1 mio views.
Customer satisfaction shows room for improvement: Average product rating held steady at 3.7, but several products fall below the 3.5 threshold—signaling the need for targeted quality or service enhancements to close the satisfaction gap.

🔍 Insights Deep Dive
1. 📊 Conversion Rate Trends
January had the highest conversion (17,3%).
October is usually the weakest conversion (6.1%) with no standout products.
September and June also performed well, pointing to seasonal demand.
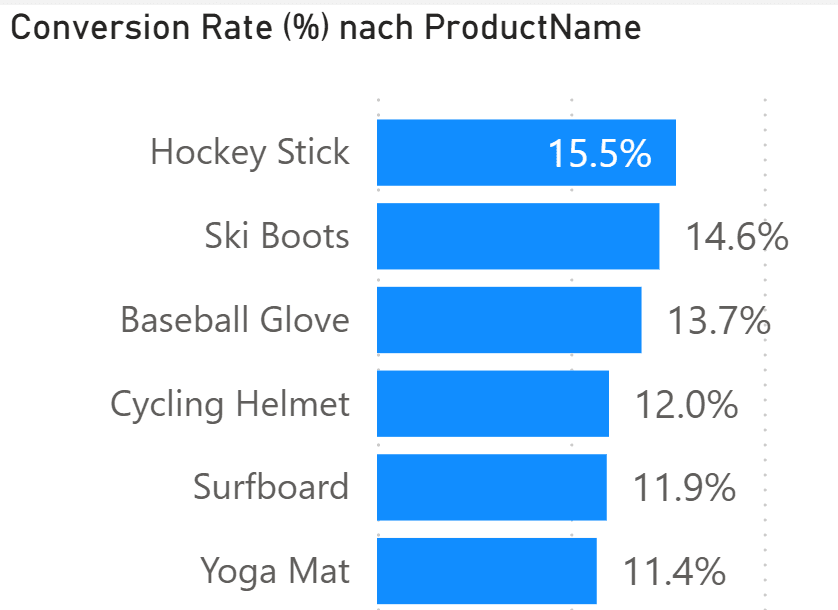
Hockey Stick (15.5%) and Ski Boots (14.6%) are consistently converting the best across months.
📌 Focus on Q1 and Q4 campaigns, and reassess May and October promotions.
📸 Visual reference: Monthly conversion rate breakdown.

Highest Conversion Rates:
Lowest Conversion Rates:

2. 🕒 Engagement Timing Patterns
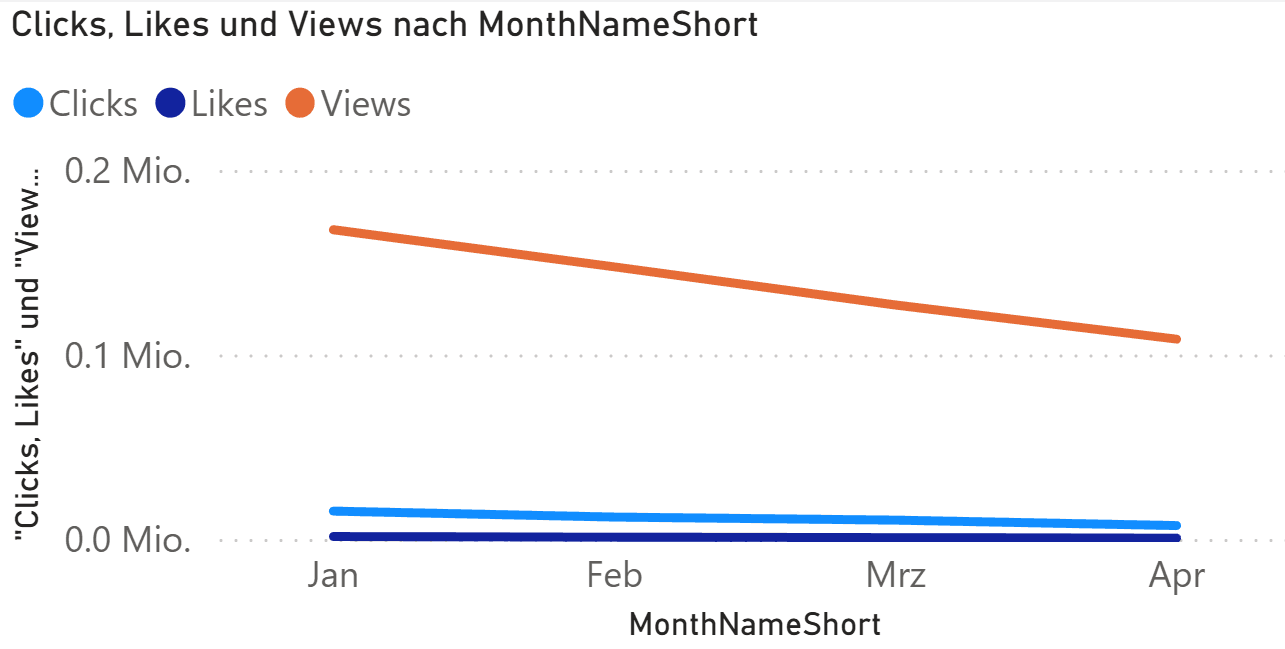
Views peaked in March and May; dropped sharply from August on.
A trend that seems to be continuing in 2025 with a drop of about 66% from its peak in 2024
Engagement decline suggests content fatigue or weaker targeting.
📌 Refresh Q3–Q4 content and test new campaign formats mid-year.
📸 Visual reference: Monthly trends for views, clicks, and likes.
Clicks, Likes and Views 2024:

2025:
3. 🎥 Content Type Effectiveness
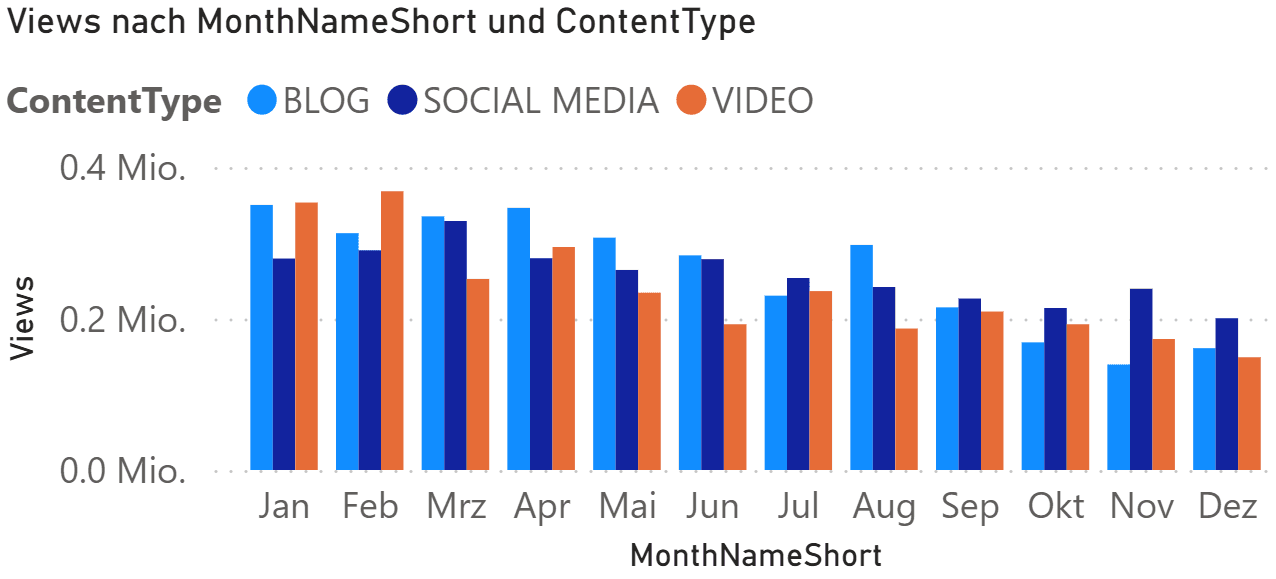
Blog content drove the most views—especially in Jan and April.
Social media and video performed steadily but didn’t spike.
Format usage remained constant; performance varies by timing/topic.
Blog impact declined in late-year, suggesting content saturation.
📌 Double down on blog content, but test high-performing topics in other formats.
📸 Visual reference: Content type engagement by month.
4. 💬 Customer Sentiment & Ratings
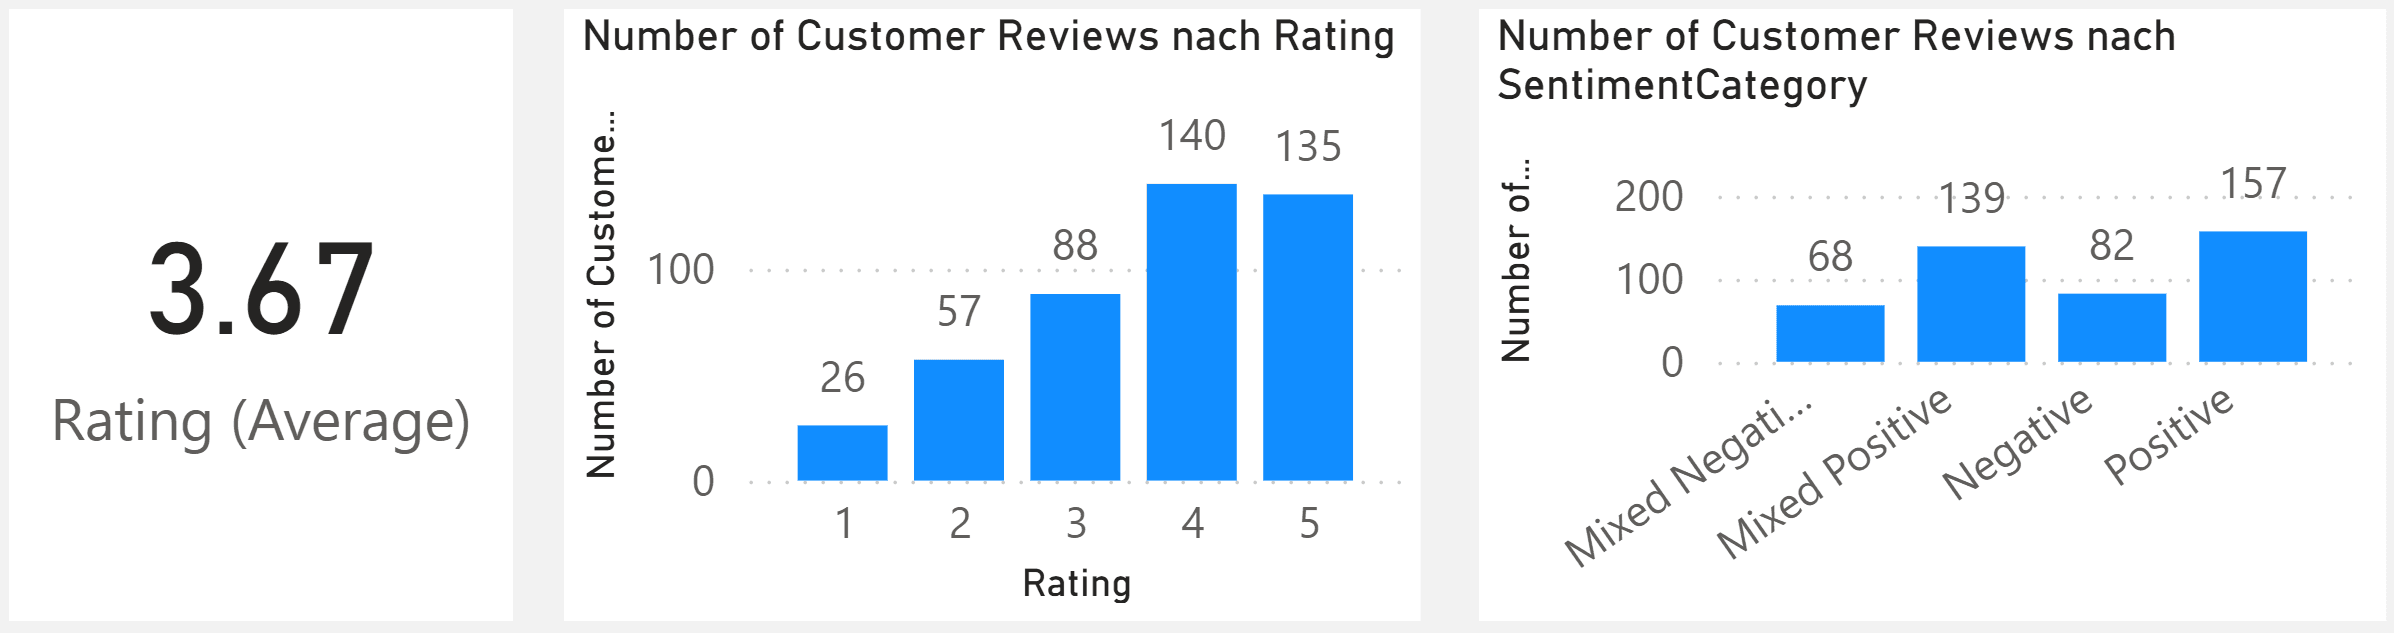
Avg. product rating didnt't change from 2024 (3.67) to 2025 (3.68).
1–2 star reviews are fewer, but signal clear improvement areas.
Sentiment analysis matches rating distribution closely.
📌 Prioritize fixing issues flagged in mixed/low reviews to raise satisfaction.
📸 Visual reference: Review sentiment and rating charts.
Rating 2024:
Rating 2025:
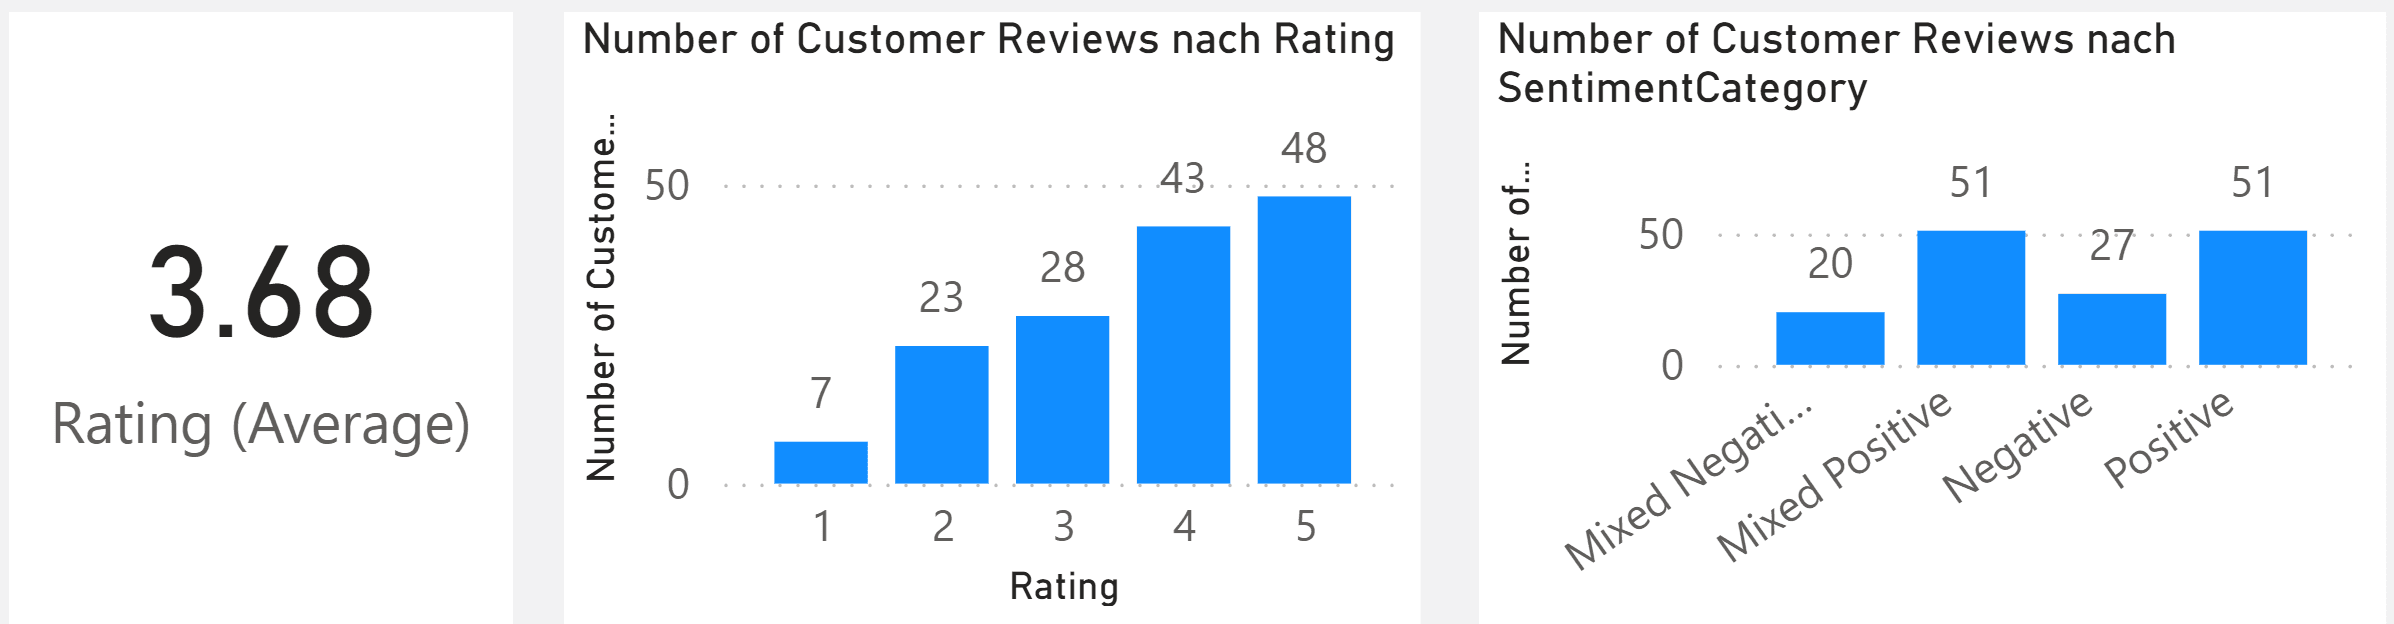
Sentiment Analysis:

✅ Final Recommendations
Run Seasonal Campaigns: Focus promotions around January and October to leverage peak conversion periods.
Boost May Performance: Test new offers, bundles, or messaging to lift results during the lowest-performing season (from March to September).
Refresh Content Formats: Introduce new formats (e.g. reels, interactive posts) to counteract late-year engagement drops.
Double Down on Blogs: Maintain blog output and repurpose top articles into short-form content for broader reach.
Fix Low-Rated Products: Prioritize improvements on items rated below 3.5 and address key complaints from mixed reviews.
Encourage Re-Rating: Follow up with dissatisfied customers after resolution to improve average sentiment.